
Wi-Mark: reception benchmark
- Android, Network Tech, WIFI Direct
- July 3, 2022
- 0
Roei Tabak
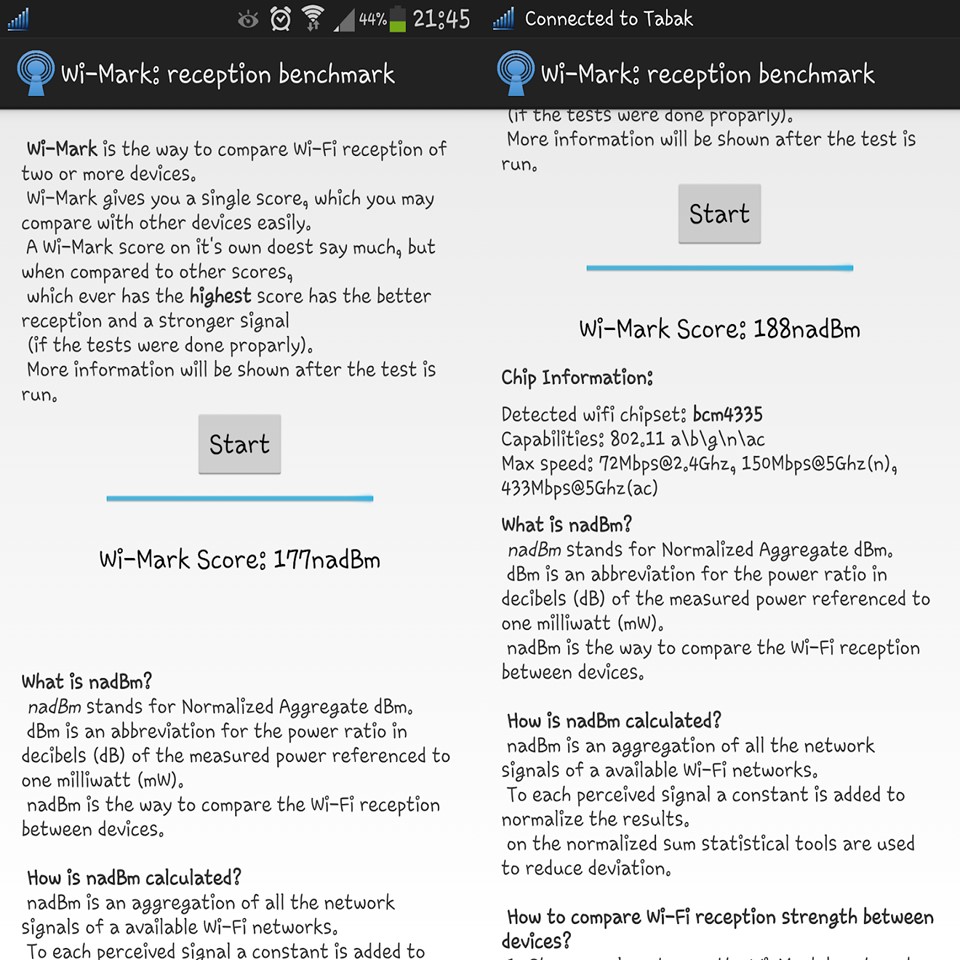
Wi-Mark is the best way to compare wifi reception between devices.
Wi-Mark gives a score in the form of nadBm, which is easily comparable with other devices. Whichever has the highest nadBm in the same environment has the better Wi-Fi reception.
nadBm can go from 0 to hundreds or thousands, depending on the environment.
What is nadBm?
nadBm stands for Normalized Aggregate dBm.
dBm is an abbreviation for the power ratio in decibels (dB) of the measured power referenced to one milliwatt (mW).
nadBm is a single number that is easily comparable to other devices.
How is nadBm calculated?
nadBm is an aggregation of all the network signals of available Wi-Fi networks.
To each perceived signal a constant is added to normalize the results.
on the normalized sum statistical tools are used to reduce the deviation.
How to compare Wi-Fi reception strength between devices?
1. Choose a place to run the Wi-Mark benchmark.
2. All compared devices need to be exactly on the same spot while performing the benchmark.
3. Run the tool on all devices.
4. Whichever device has the highest score has the strongest reception.
Remember:
Many things can affect Wi-Fi reception (temperature, humidity, surrounding objects, etc.),
make sure you perform the Wi-Mark test on all devices in the same environment to ensure correct metrics.
This app also recognizes some of the devices’ wifi chipset. We’re constantly improving the detection.
Available in Google Play